
Guide Sellers to the Perfect Listing Price Using Market Data
Launch Florida Realtors SunStats
Access our powerful database of real estate market research NOW!
Pricing conversations tend to be difficult with sellers in any market because people view their homes through “love lenses.” Generally, they overvalue all the upgrades and personal touches they’ve done over the years, and even price in memories they’ve made while in the home.
These conversations are dicey in normal times, and even more so as the market shifts in favor of buyers.
Market changes are inevitable, and often the hardest part about them is communicating shifts to clients in a way they can understand and, more importantly, accept.
Sellers often talk to their neighbors and hear stories about the money a recent seller down the street got, and they want the same deal, or a better one, for their property.
So, what’s a Realtor to do? If facing unrealistic sellers, they should use data. Showing sellers cold, hard statistics can often ground the conversation. It can help sellers move past their emotions about their home in particular and the marketplace in general.
Using data to suggest listing prices
In Florida, Realtors can use SunStats to show sellers the changing landscape of the marketplace – and how to be more realistic when setting a price for their home. Comps, of course, will be the way to actually set the price of the home, but SunStats shows the temperature of the marketplace, something comps simply cannot do.
A few metrics can help sellers understand what to expect.
The first is Active Inventory, which is the number of homes actively on the market at a particular time. Start with a look at the property type (single family or condo/townhome) in your zip code. Get a sense of how many homes are currently on the market but, most importantly, how that has been changing.
In most areas, Active Inventory has been increasing steadily since around June 2022. This tells sellers that there is more product on the market for buyers to choose from. Next, take a peek at Active Inventory in the price tier of your particular property. Often, this can vary slightly depending on your area.
New Pending Sales is a “leading indicator.” That means you can somewhat expect Closed Sales to follow suit with what you see in New Pending Sales within a month or two. Again, the direction of this number is more important than the current number. If New Pending Sales is trending down, you can expect the same for Closed Sales. Fewer deals closing indicates lighter demand.
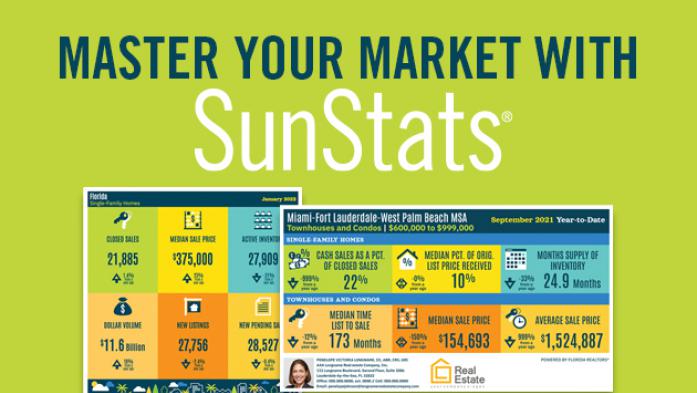
Graphs and charts not your thing? No worries. An “Expectations Infographic” is the client-facing image you can use. Hop on over to the Infographic Creator tab within SunStats to create a graphic that focuses on the metrics your client needs to know to understand the changing landscape.
Select the following metrics:
- Closed Sales
- Median Sale Price
- Active Inventory
- Months Supply of Inventory
- New Listings
- New Pending Sales
This will create a graphic that you can share on your socials, via email to a client, in a newsletter or on your website.
Most importantly, this graphic shows the current numbers and how they compare year-to-year. In most markets today, the trends show higher inventory, fewer closed sales, increasing Months Supply of Inventory and a decrease in Pending Sales. Even Median Sale Price, while still high, is not showing double digit year-over-year gains.
Having this in front of you while meeting with a seller can help guide you through that ever-difficult expectations conversation.
Jennifer Warner is an economist and Director of Economic Development
© 2022 Florida Realtors®