Using SunStats Market Research Tool in a Changing Market
The breakneck pace of market changes has even the most seasoned Realtors experiencing whiplash. Just 12 months ago, homes were flying off the market as soon as they were listed and often with a very different set of terms (think waived appraisals and inspections and more all-cash offers) than typically seen. Some sellers were unlocking massive equity while buyers were getting into homes at historically low interest rates, boosting their purchasing power.
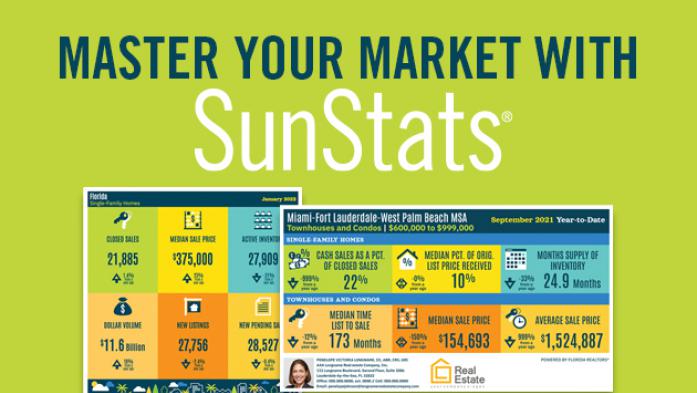
Launch Florida Realtors SunStats
Access our powerful database of real estate market research NOW!
Smash cut to today where market conditions are starting to become vastly different. But how do you know if what you’re seeing in the field reflects a particular deal or if it points to a broader market trend? That’s where a peek into the data available exclusively to Florida Realtors members becomes invaluable.
Market stats help set the table
Like with most things in life, events need context to be understood. Take the listing you just got and put on the market. Is it sitting a little longer than you would have expected given how things had been going? Are buyers seeming a little choosier and making more “down to earth” offers? Aside from any particularities of the house itself, could this shift be due to a broader market trend? Here’s how to find out.
3 key indicators
Data can tell a story, but you need to know what to look for to get the entire picture.
Put together, Active Inventory, Median Time to Sale and Median Sales Price can indicate the overall health and pace of the market. Simply put, the more there is on the market and the longer it takes to sell, prices will typically fall.
When the supply of homes for sale for buyers to choose from, or active inventory is low, and has been trending lower for several months, you know that there is less for buyers to choose from. This creates competition among buyers who then start waiving contingencies and placing higher bids to win, which increases the median sale price over time. In aggregate, the more people start paying over what the seller asks (and even what the house will appraise for), the higher the median sale price will be. When you look at these two metrics side by side, you can see that as inventory goes down, median sale price starts to increase. It’s a simple display of supply and demand – the less there is of something, the more expensive it will be.
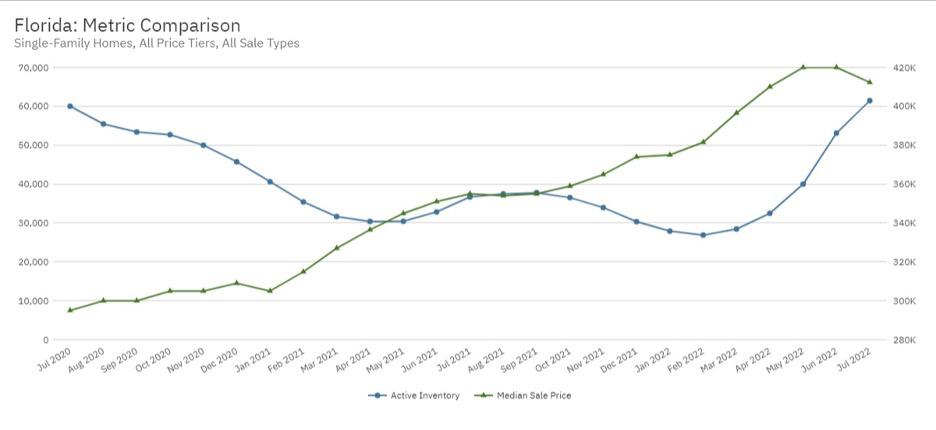
However, things may be starting to shift. After bottoming out in February 2022, active inventory has been increasing each month. While the median sale prices are still high, the pace of growth has started to slow, perhaps an indication that more inventory is lessening the competition among buyers who can put more reasonable deals together. Economists also look to the increasing interest rates as a contributing factor for declining demand, as the cost of a mortgage has accelerated considerably in the past year, kicking more and more people out of the pool of potential buyers.

Then you have to consider how long deals are taking to go from list to closed. The faster this pace, the “frothier” the market. Before the pandemic, a typical single-family home in Florida took around 90 days to close. This allowed for all the pieces to fall into place – buyers considered all their options, did due diligence, may have had a contingency to sell their home, used traditional financing – all the “normal” practices.
That all changed when inventory shrank, demand accelerated and buyers were looking to upgrade, take advantage of low interest rates or finally get out of rentals. The heavy competition changed the rules of engagement as the number of cash deals (which close much faster than financed deals) increased. This is a metric to continue to keep an eye on, particularly in deals where you’re representing a seller. Putting a home under contract in a week after fielding multiple offers may not materialize anymore.
Price tier matters
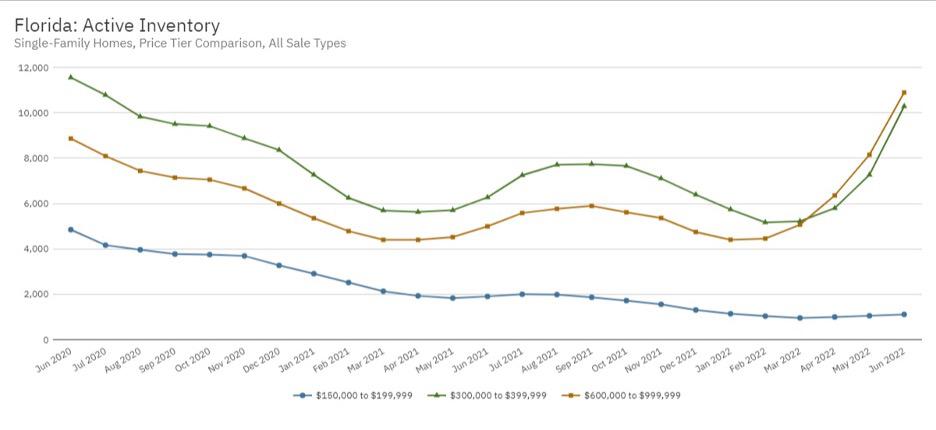
Not all markets are equal and not all price points are either. Consider this chart below. The active inventory for homes in the lower price point remains well below where it was two years ago, whereas there has been a sharp increase for the higher price points.
What’s in your market?
No two parts of Florida are the same and neither are their real estate markets. Headlines and general talking points are fine, but you owe it to yourself and your clients to dive into what’s happening locally. Take some time to explore SunStats (sunstats.floridarealtors.org) and pull up these three metrics in your market and see what’s happening.
Jennifer Warner is an economist and Director of Economic Development
© 2020 Florida Realtors®