
Timing Matters More for Florida Sellers
Florida sellers could see higher prices and quicker sales by listing in early to mid-April. Here’s why timing your listing could make a difference this spring.
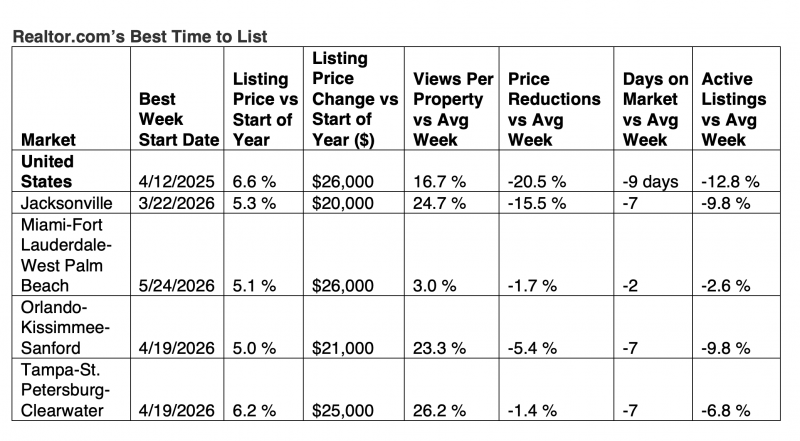
ORLANDO, Fla. – While April 12-18 is projected as Realtor.com’s best week to list nationally in 2026, Florida sellers may see similar advantages by timing their listings to local spring demand, which peaks at slightly different times across the state.
In markets such as Orlando, Tampa and Jacksonville, the optimal window falls in early to mid-April, aligning closely with the national trend. Realtor.com data shows sellers who list during these periods could see listing prices roughly 5% to 6% higher than at the start of the year, translating to gains of about $20,000 to $25,000 depending on the metro.
That timing matters more in Florida, where inventory has been rising and buyers have gained leverage in many areas. Listing during this early spring window allows sellers to capture renewed buyer activity tied to improving affordability, while avoiding the heavier competition that typically builds heading into late spring and summer.
Mortgage rates easing into the low-6% range and dipping into the 5% range earlier this year are expected to bring more buyers back into the market. In Florida metros, that demand is already showing up in higher listing views and faster sales during peak weeks, particularly in Central and North Florida.
However, the “best week” varies across the state. Jacksonville’s window arrives earlier, around late March, while South Florida markets such as Miami tend to peak later in the spring as inventory remains elevated and competition is stronger. Orlando and Tampa both align closely with the mid-April timeframe, offering a balance of strong pricing, steady demand and manageable competition.
The takeaway for Florida sellers: timing still matters, but local conditions matter more. In a market with more listings and more selective buyers, entering early in the spring cycle can help a property stand out, attract stronger offers and reduce the likelihood of price cuts.
Methodology
Listing metrics (e.g. list prices) from 2018-2019 and 2021-2025 were measured on a weekly basis, with each week compared against a benchmark from the first full week of the year. Due to the onset of the pandemic, 2020 was an uncharacteristic year and has therefore been excluded from the analysis. Averaging across the years yielded the "typical" seasonal trend for each metric. Percentile levels for each week were calculated along each metric (prices, listings, days on market, etc.), and were then averaged together across metrics to determine a Best Time to List score for each week. Rankings for each week were based on these Best Time to List scores
Each week was scored based on favorability toward sellers — this included competition from other sellers (active listings and new listings), listing prices, market pace (days on market), likelihood of price reductions, and homebuyer demand (views per property on Realtor.com). Percentile levels for each week were calculated along each metric and were then averaged together across metrics to determine a Best Time to Sell score for each week. Rankings for each week were based on these Best Time to Sell scores.
Source: Realtor.com
© 2026 Florida Realtors®